
LiDAR Forest Structure, Terrain & Drainage Analysis
A LiDAR-based terrain and forest-structure workflow combining point-cloud processing, bare-earth elevation modelling, canopy-height analysis, Vegetation Resources Inventory comparison, and terrain-derived drainage screening in ArcGIS Pro.
Tools Used




Python
Geodatabases
ArcGIS Pro
LiDAR/LAS
-
Airborne LiDAR provides detailed information about both the ground surface and features above it, but the original point cloud must be processed into usable terrain and vegetation products before it can support meaningful GIS analysis.
I developed this representative workflow using publicly available provincial LiDAR, forest-inventory, hydrographic, and road datasets for a forested study area near Myra-Bellevue, British Columbia. The objective was to demonstrate how LiDAR can support an integrated analysis of terrain form, vegetation structure, forest-inventory variation, potential surface-flow pathways, and road–drainage interactions.
The project focuses on practical GIS analysis and screening rather than standalone point-cloud visualization. The outputs are intended to demonstrate LiDAR processing, raster modelling, forestry-data integration, hydrologic analysis, QA/QC, and cartographic communication.
-
The technical work focused on converting airborne LiDAR into aligned terrain and vegetation products that could be compared with supporting provincial datasets.
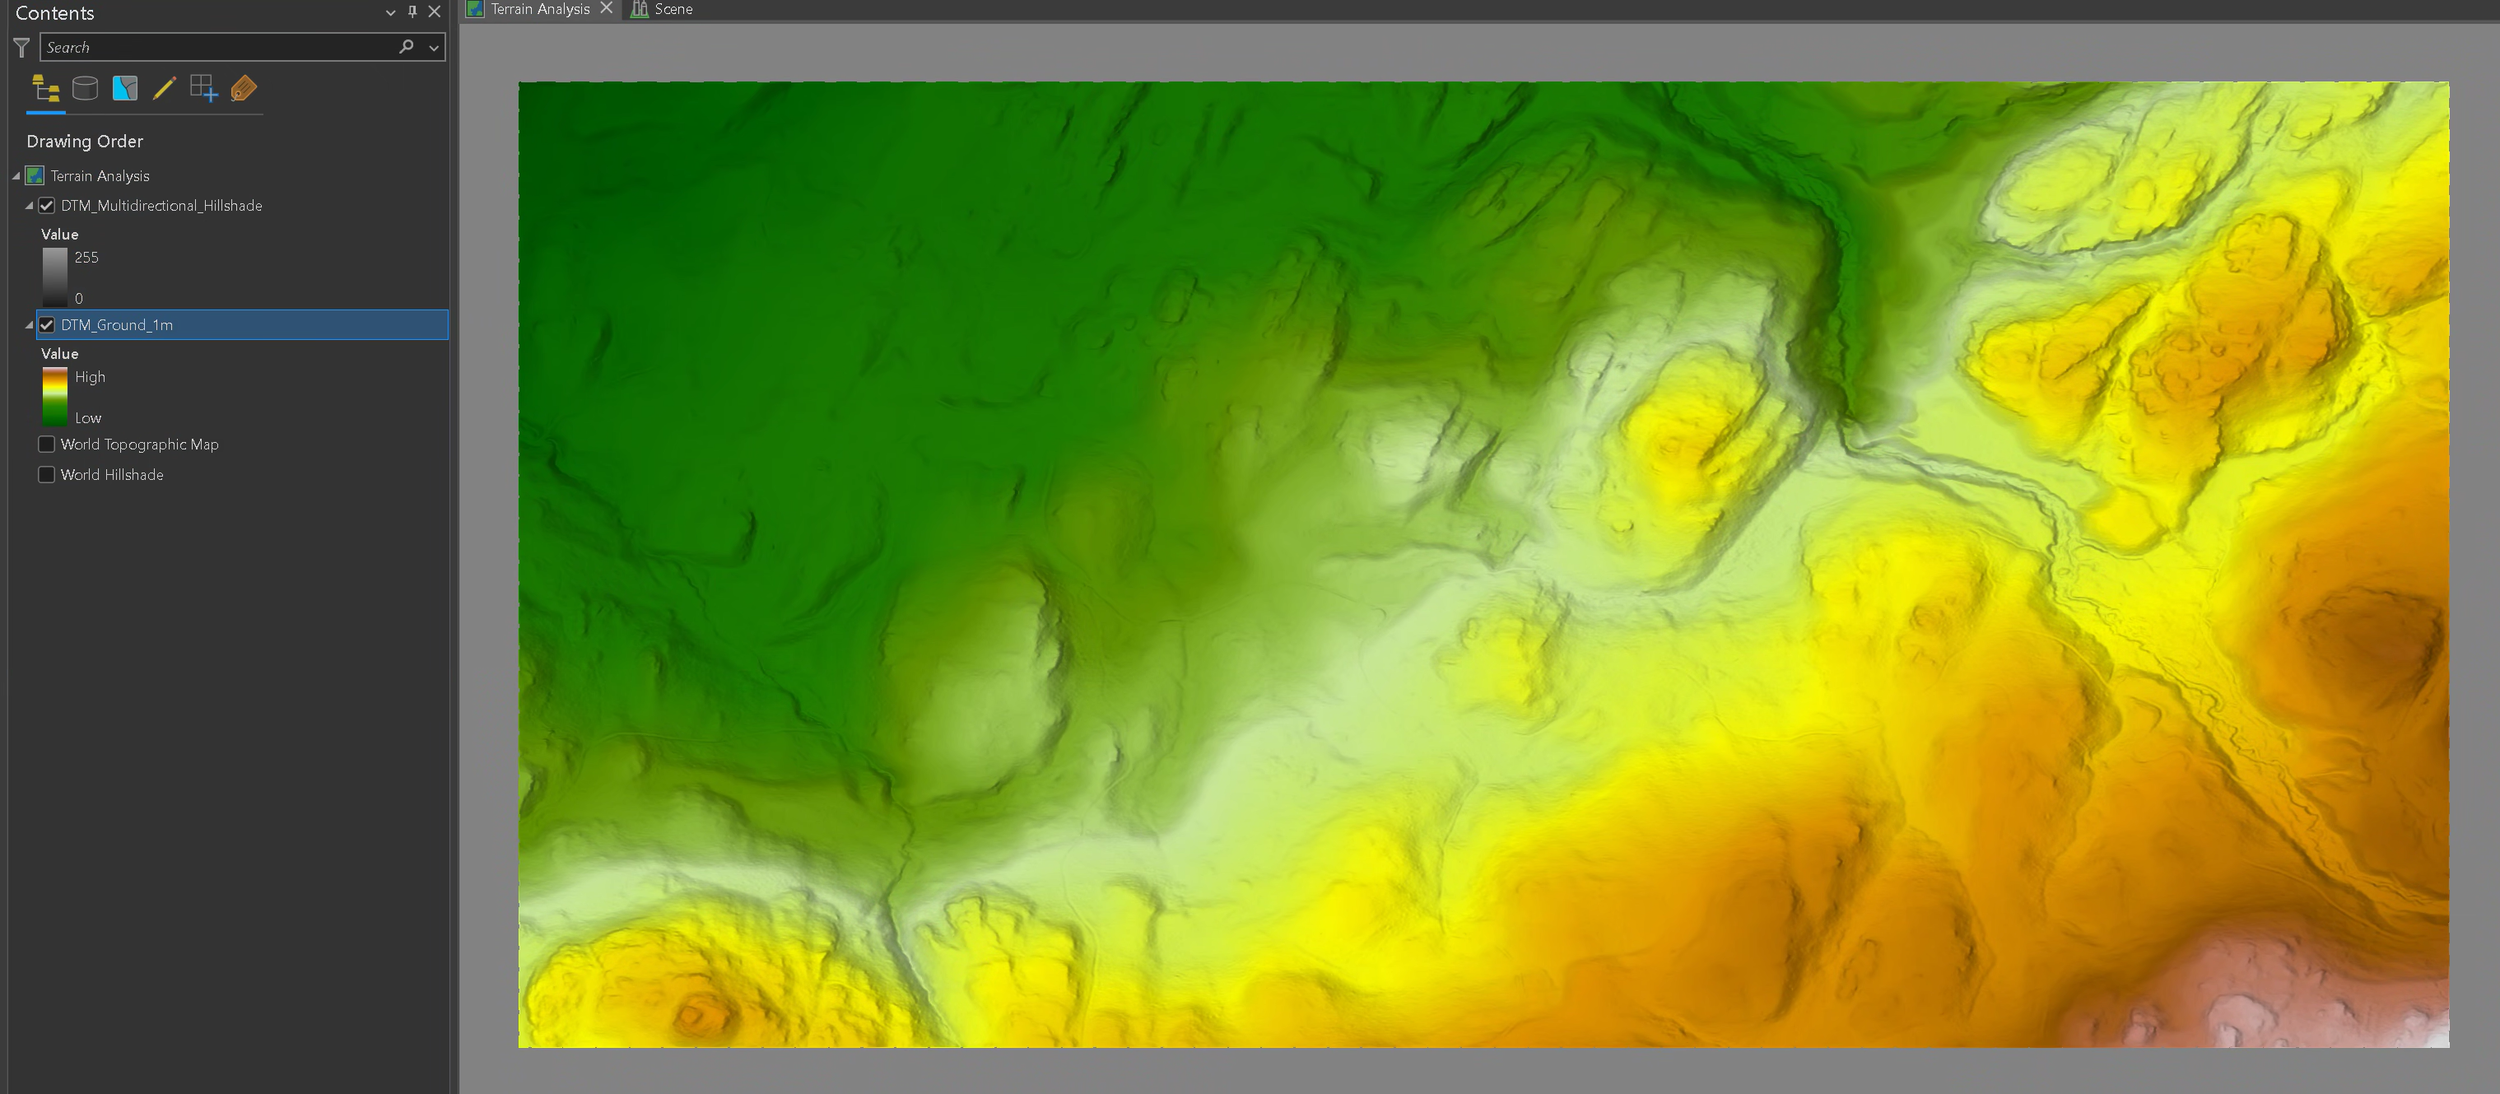
Ground-classified returns were used to create a 1 m bare-earth digital terrain model. First-return and exposed-ground points were used to create a digital surface model, and the terrain model was subtracted from the surface model to calculate vegetation height above ground.
The resulting canopy-height model was filtered to reduce isolated raster noise and grouped into five illustrative structural classes:
Ground and very low vegetation: 0–2 m
Low vegetation and regeneration: 2–10 m
Intermediate canopy: 10–20 m
Tall canopy: 20–30 m
Very tall canopy: 30–50 m
Vegetation Resources Inventory polygons were also summarized using the LiDAR canopy-height surface. The 95th-percentile LiDAR height was compared with the VRI projected stand-height attribute for polygons containing sufficient valid LiDAR coverage.
Terrain processing included sink filling, D8 flow direction, flow accumulation, contributing-area thresholding, and vector conversion of potential surface-flow pathways. These pathways were compared with mapped streams and roads to identify candidate road–flow-path interaction locations.
-
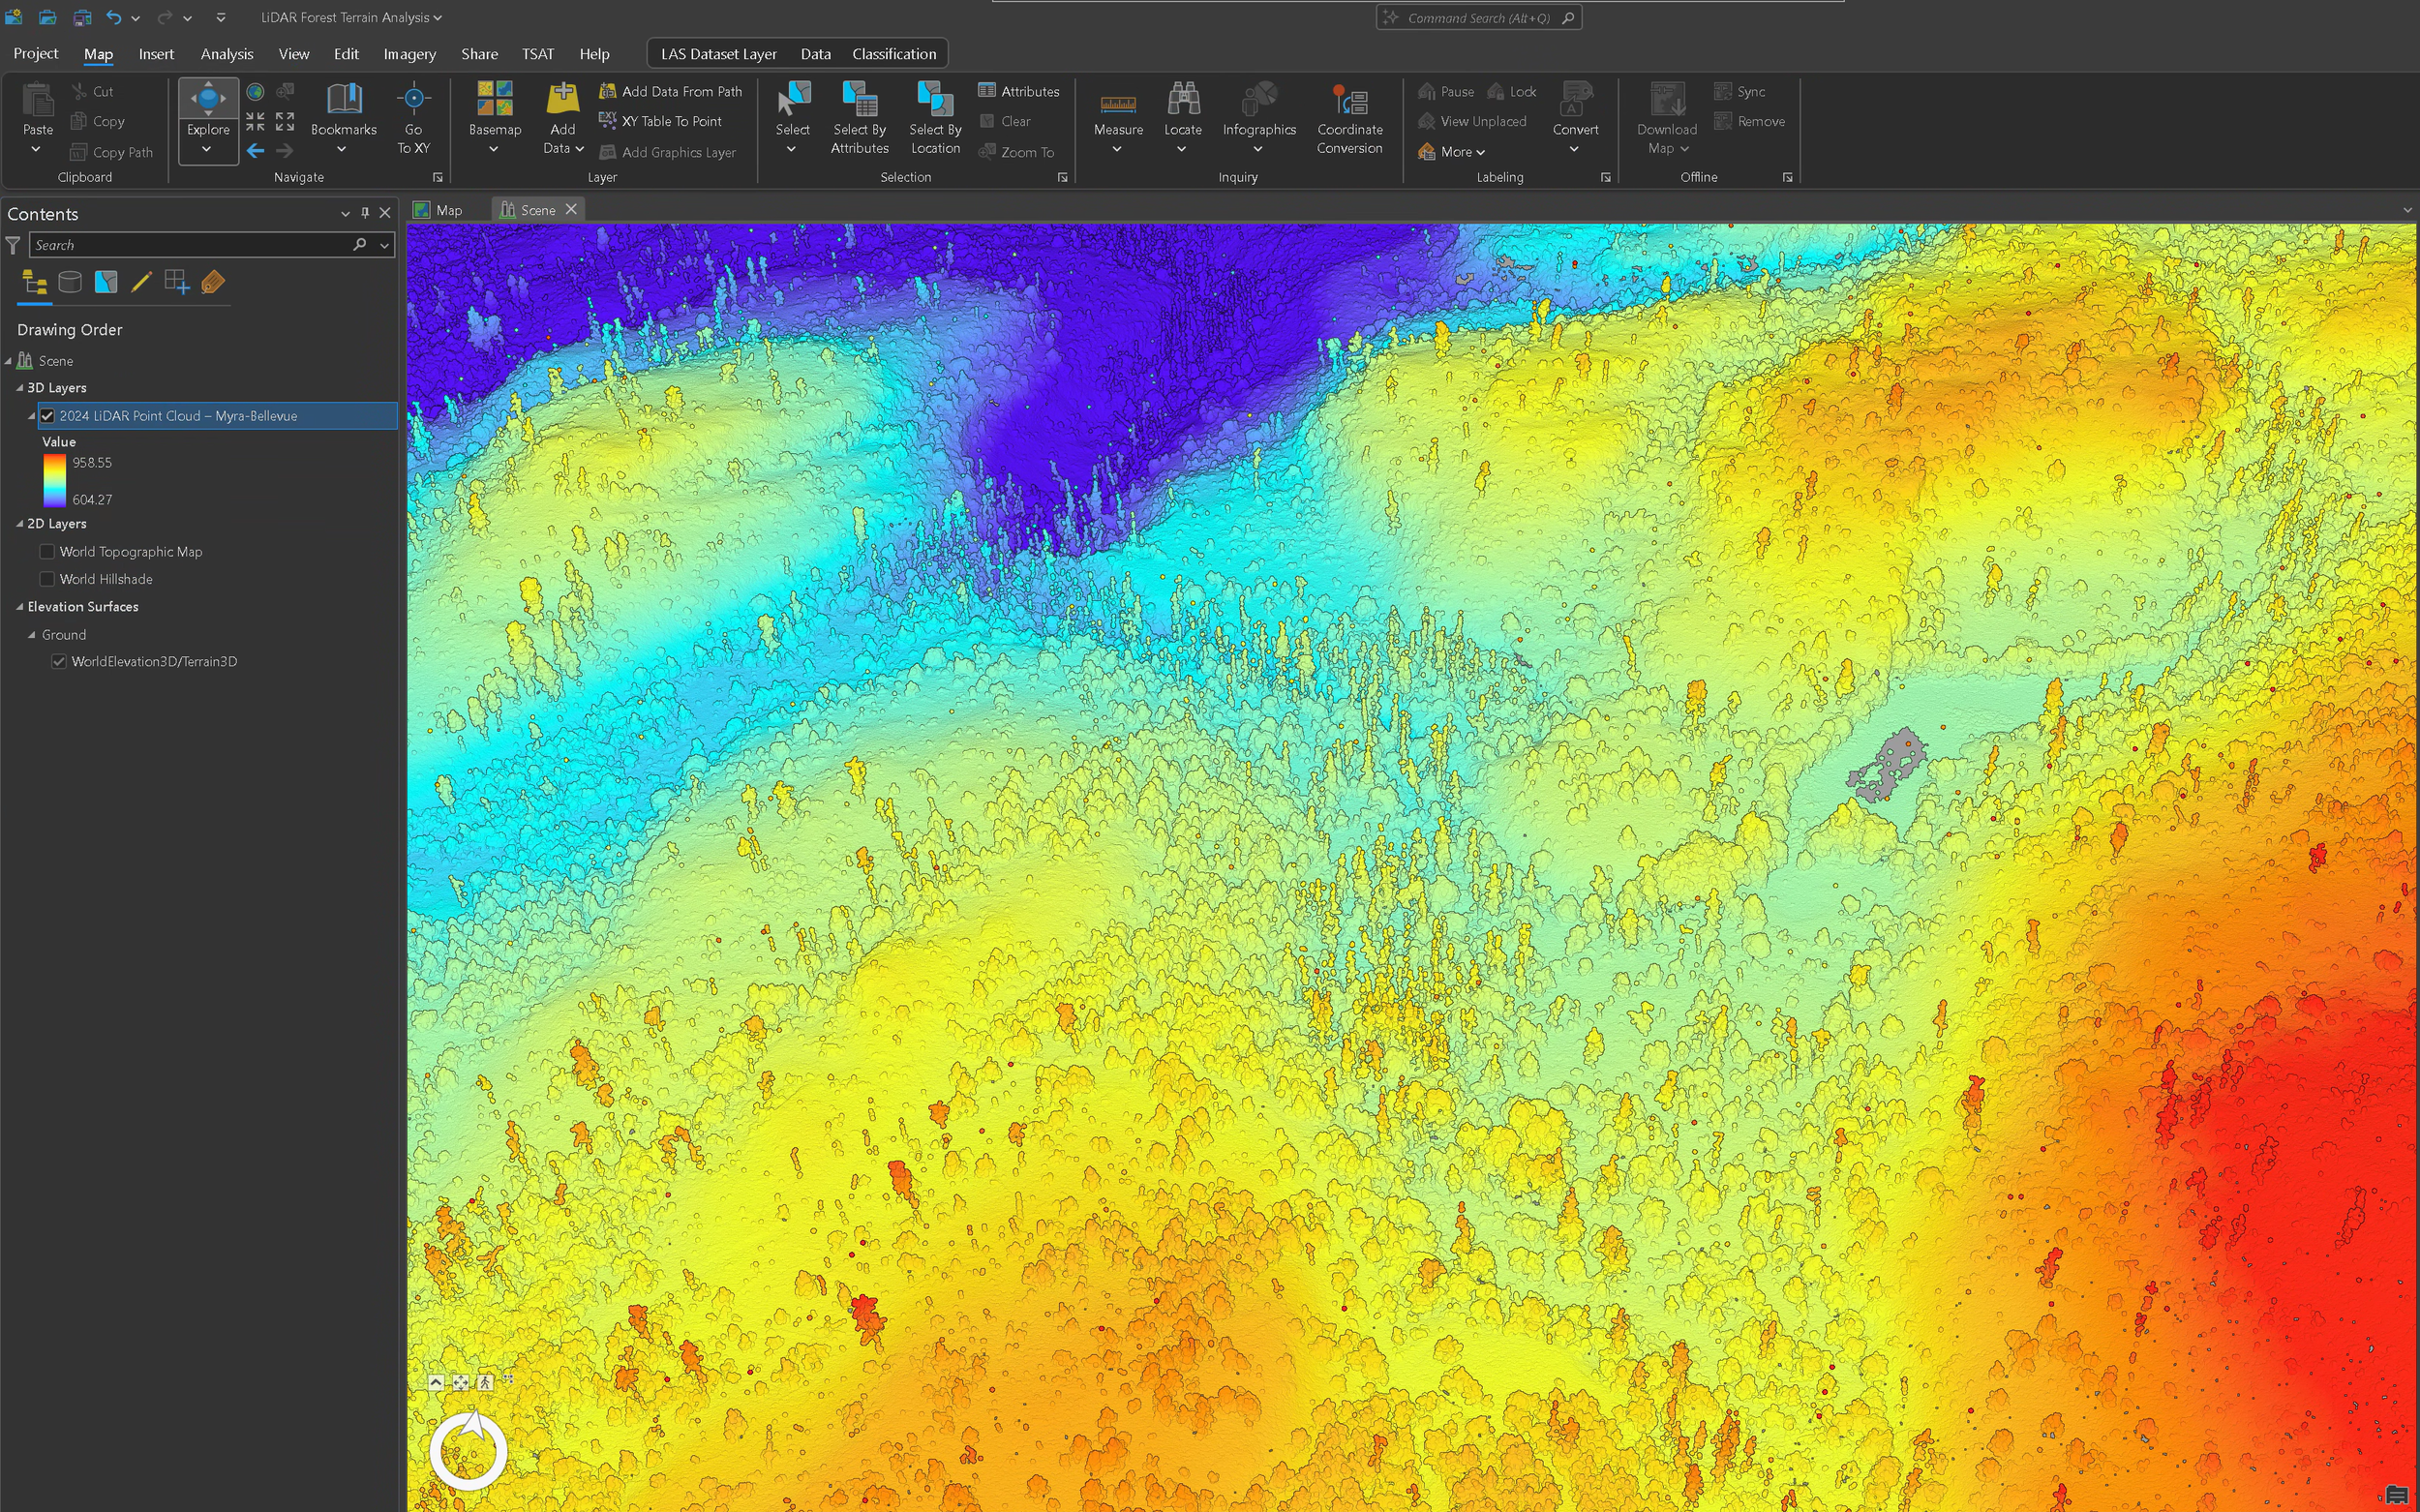
The compressed LAZ point cloud was converted to LAS and organized for processing in ArcGIS Pro. Point classifications and return filters were reviewed before producing separate terrain and surface outputs.
The main workflow included:
Converting the source LAZ point cloud and validating its coordinate system, elevation range, point classifications, and spatial coverage.
Filtering ground returns and interpolating a 1 m bare-earth digital terrain model.
Creating a multidirectional hillshade to improve the interpretation of ridges, valleys, channels, benches, and terrain breaks.
Creating a first-return digital surface model and subtracting the terrain model to calculate canopy height.
Applying a 3 × 3 median filter and classifying the canopy-height surface into representative vegetation-structure ranges.
Clipping VRI polygons to the LiDAR study area and calculating mean, median, maximum, and 95th-percentile canopy-height statistics by polygon.
Comparing LiDAR P95 canopy height with VRI projected stand height while excluding polygons with limited valid raster coverage.
Processing the terrain model through Fill, Flow Direction, and Flow Accumulation tools.
Applying a 2.5 ha contributing-area threshold to retain the more prominent terrain-derived flow pathways.
Comparing modelled flow paths with mapped hydrography and roads and identifying candidate interaction locations.
Python and ArcPy were used to automate portions of the VRI–LiDAR comparison, calculate signed and absolute height differences, create the comparison feature class, generate the scatter chart, apply map symbology, and export supporting outputs.
-
The completed workflow produced:
A processed and filtered LiDAR point-cloud dataset
A 1 m bare-earth digital terrain model
A multidirectional terrain hillshade
A digital surface model
A canopy-height model
Five representative canopy-height classes
LiDAR canopy statistics summarized by VRI polygon
A comparison of VRI projected height and LiDAR P95 canopy height
Terrain-derived potential surface-flow pathways
Mapped stream and road overlays
Candidate road–flow-path interaction locations
Static-ready maps, charts, and 3D visualizations
The project demonstrates how LiDAR can be used as more than a visualization product. Derived terrain and canopy surfaces can support preliminary forest-structure review, inventory comparison, terrain interpretation, drainage screening, access planning, road-crossing prioritization, environmental assessment, and field-investigation planning.
The VRI comparison also demonstrates the importance of interpreting different data products carefully. Differences between VRI projected height and LiDAR-derived canopy height may reflect inventory vintage, forest openings, regeneration, disturbance, crown closure, partial polygon coverage, or differences in how each dataset represents stand height.
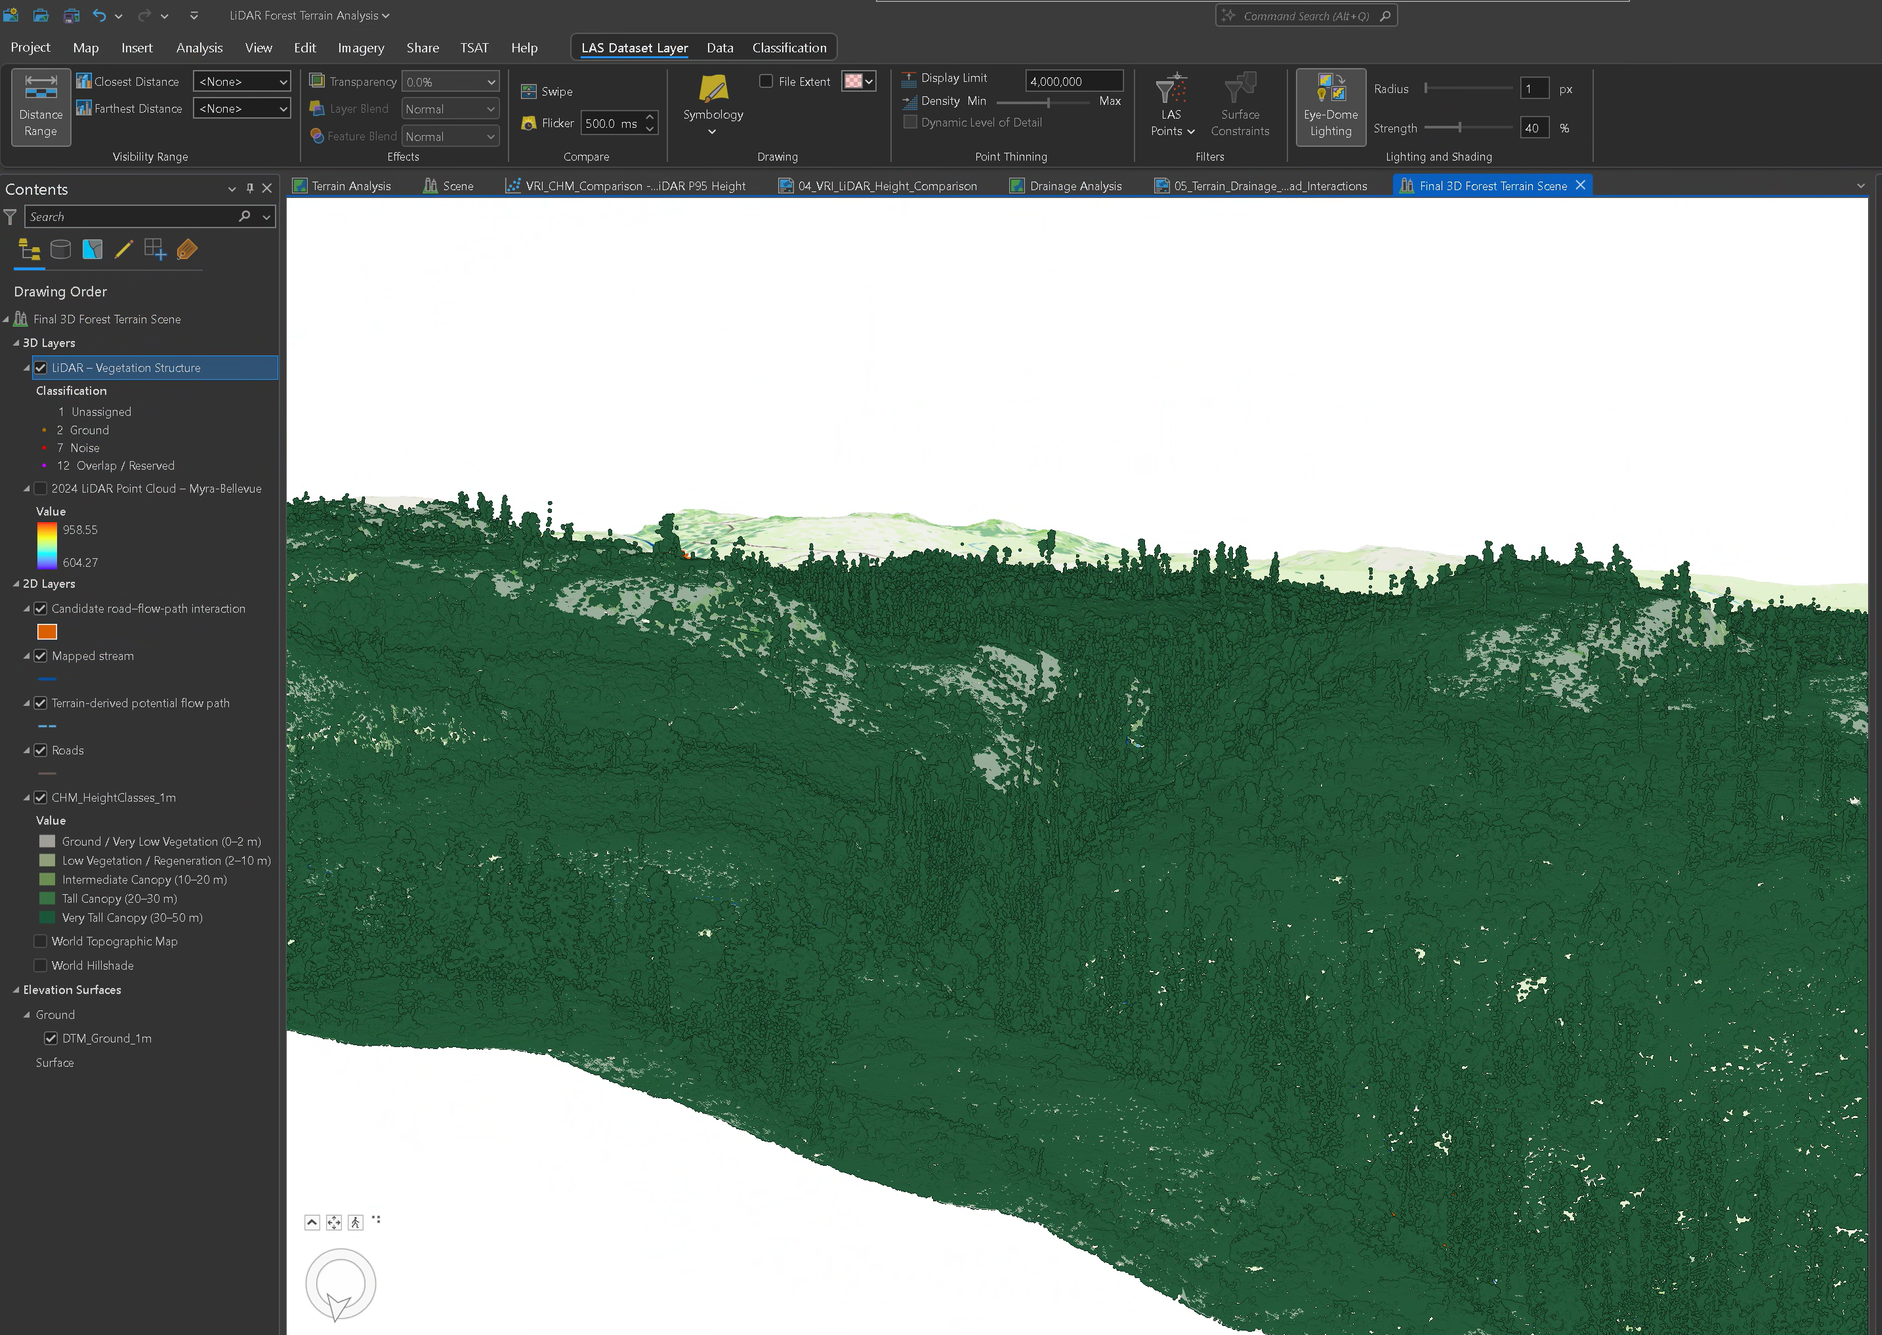
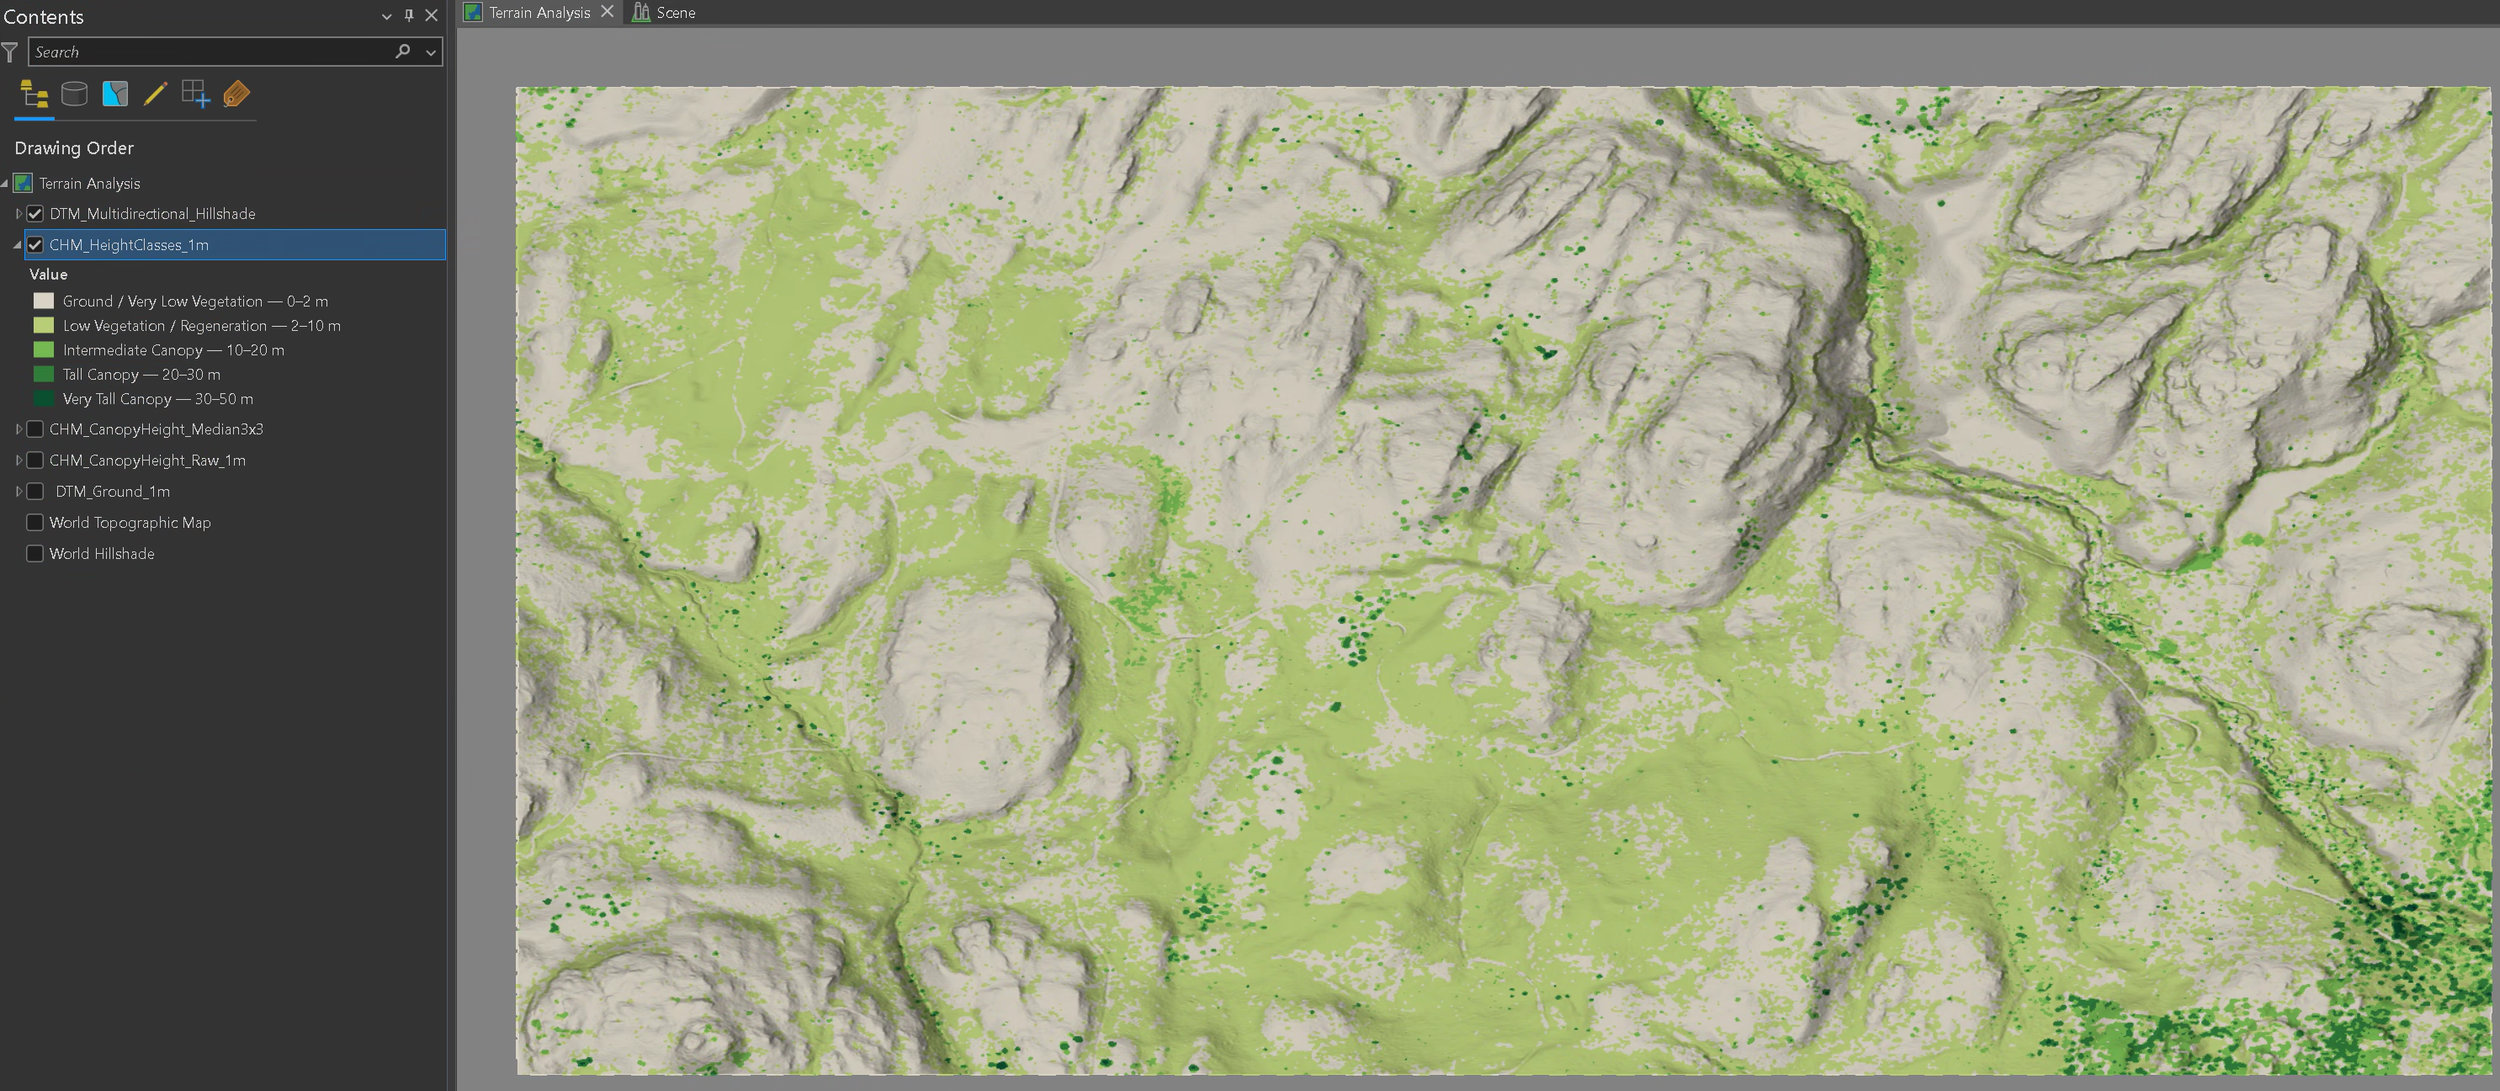
LiDAR-derived canopy-height classes showing ground and very low vegetation, regeneration, intermediate canopy, tall canopy, and very tall canopy across the Myra-Bellevue study area.
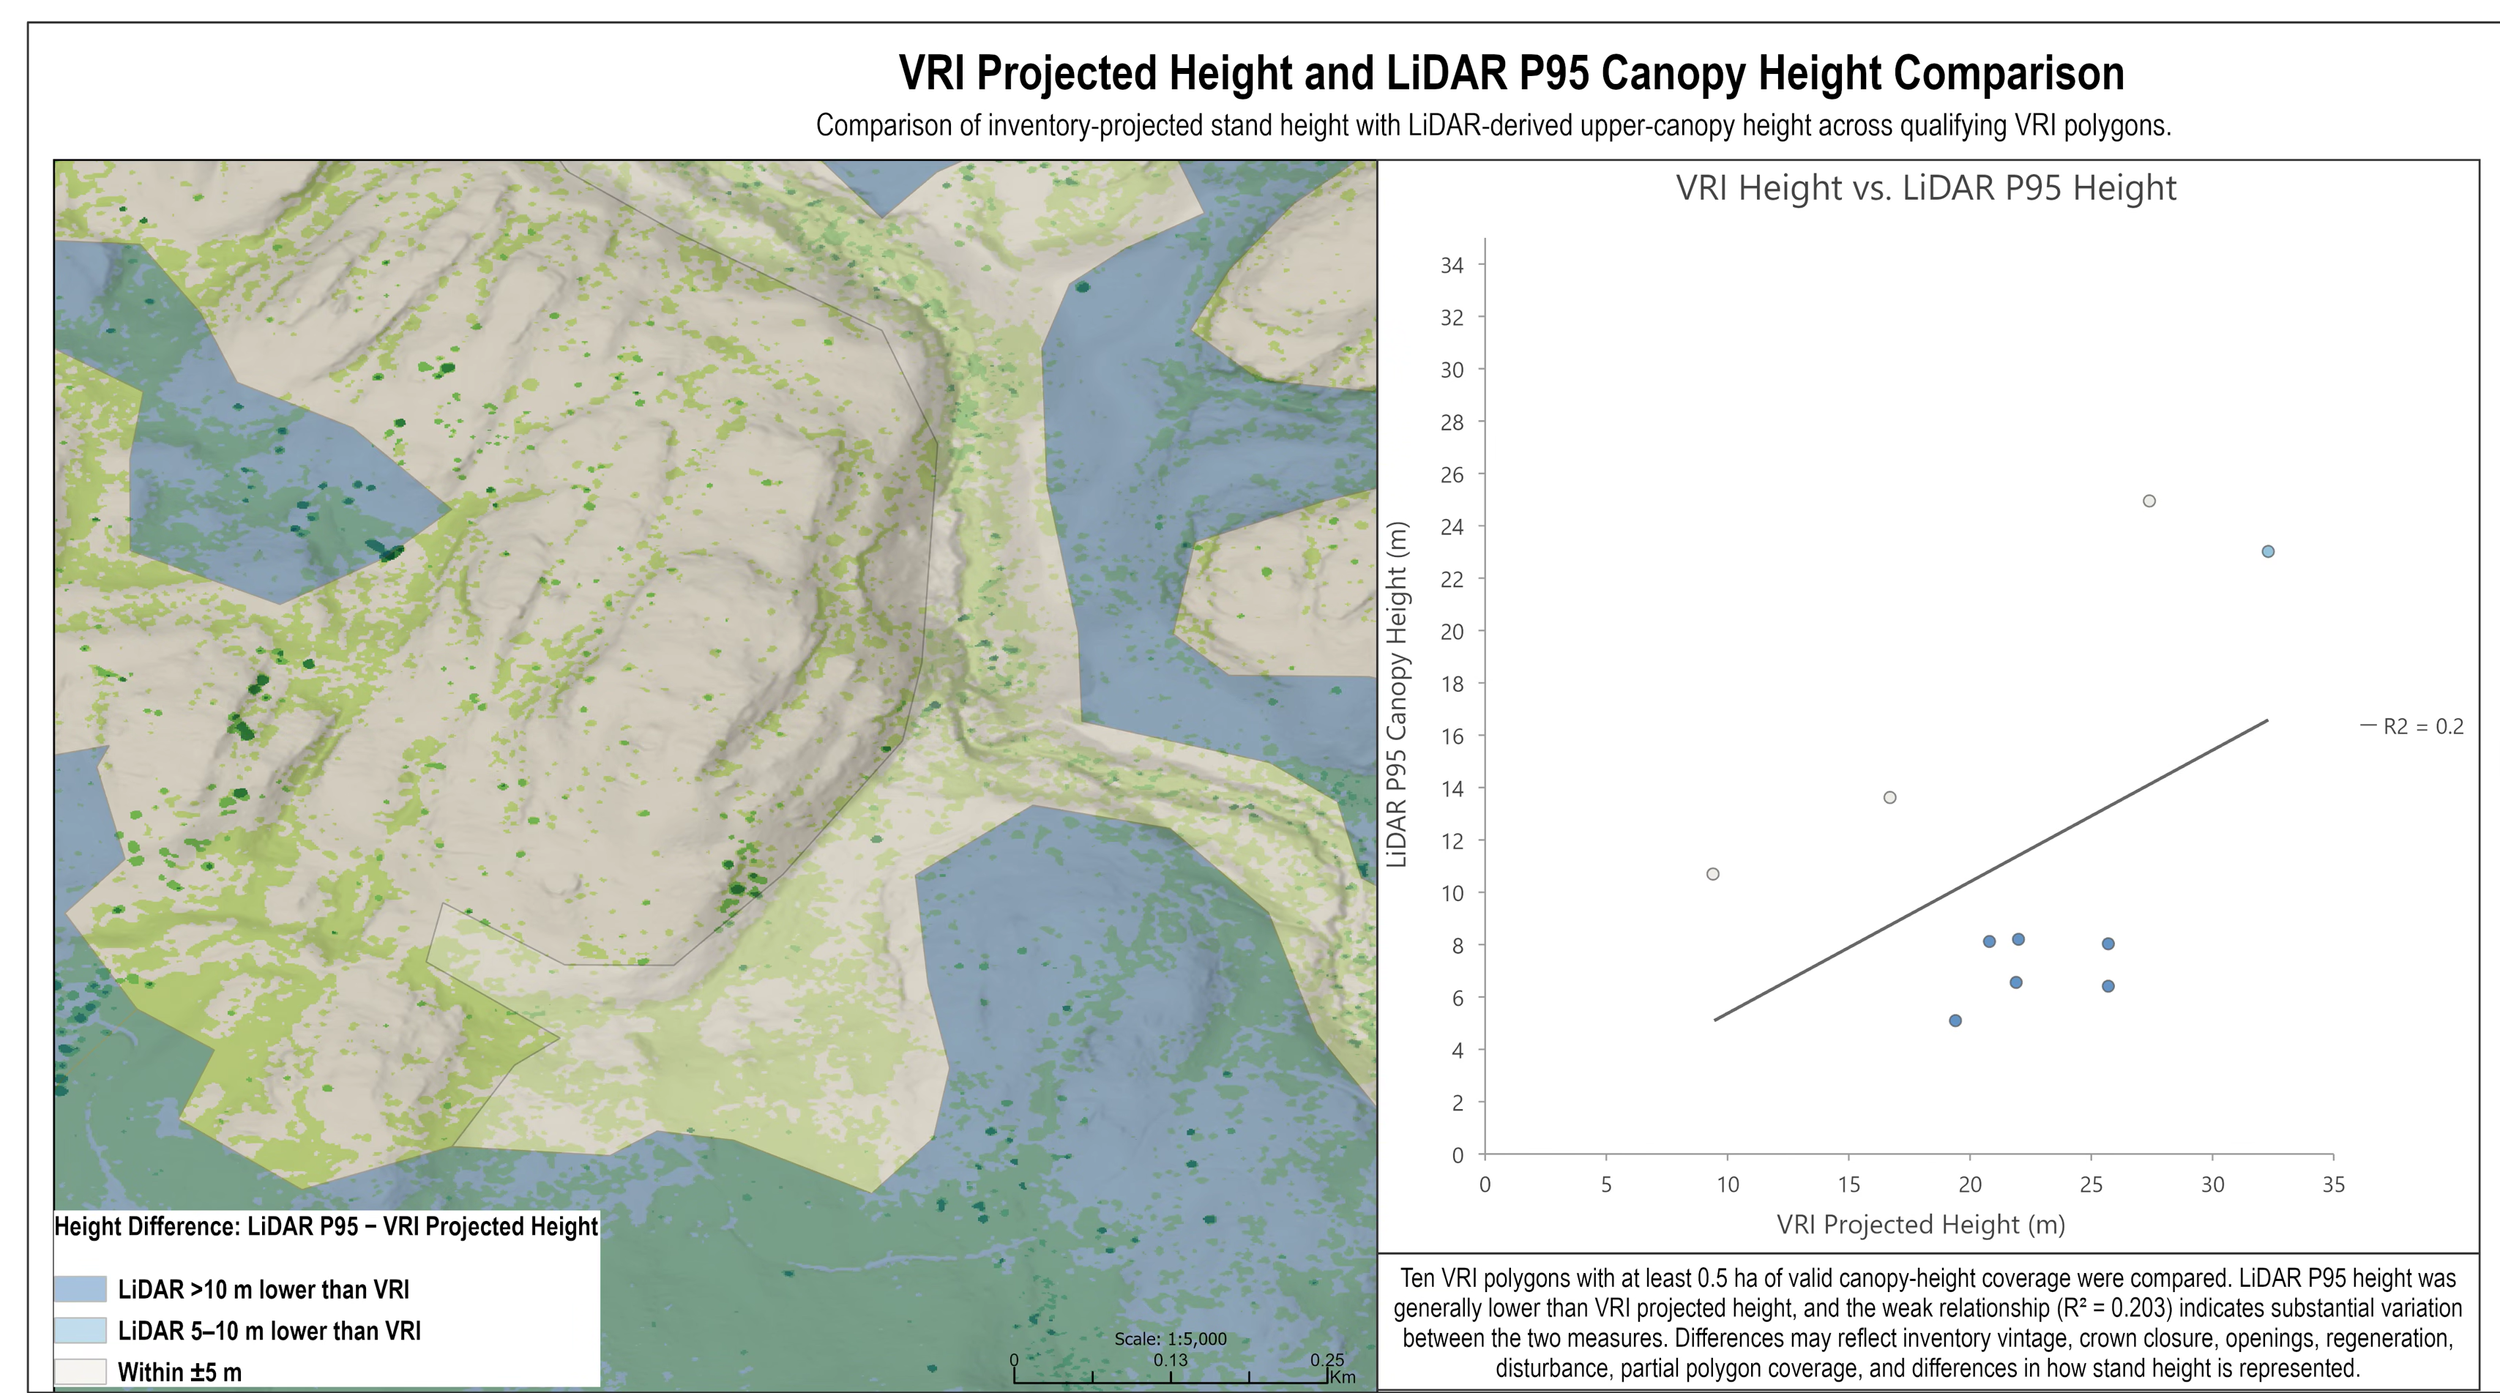
Comparison of VRI projected stand height and LiDAR-derived 95th-percentile canopy height, highlighting spatial differences and variability across qualifying forest-inventory polygons.
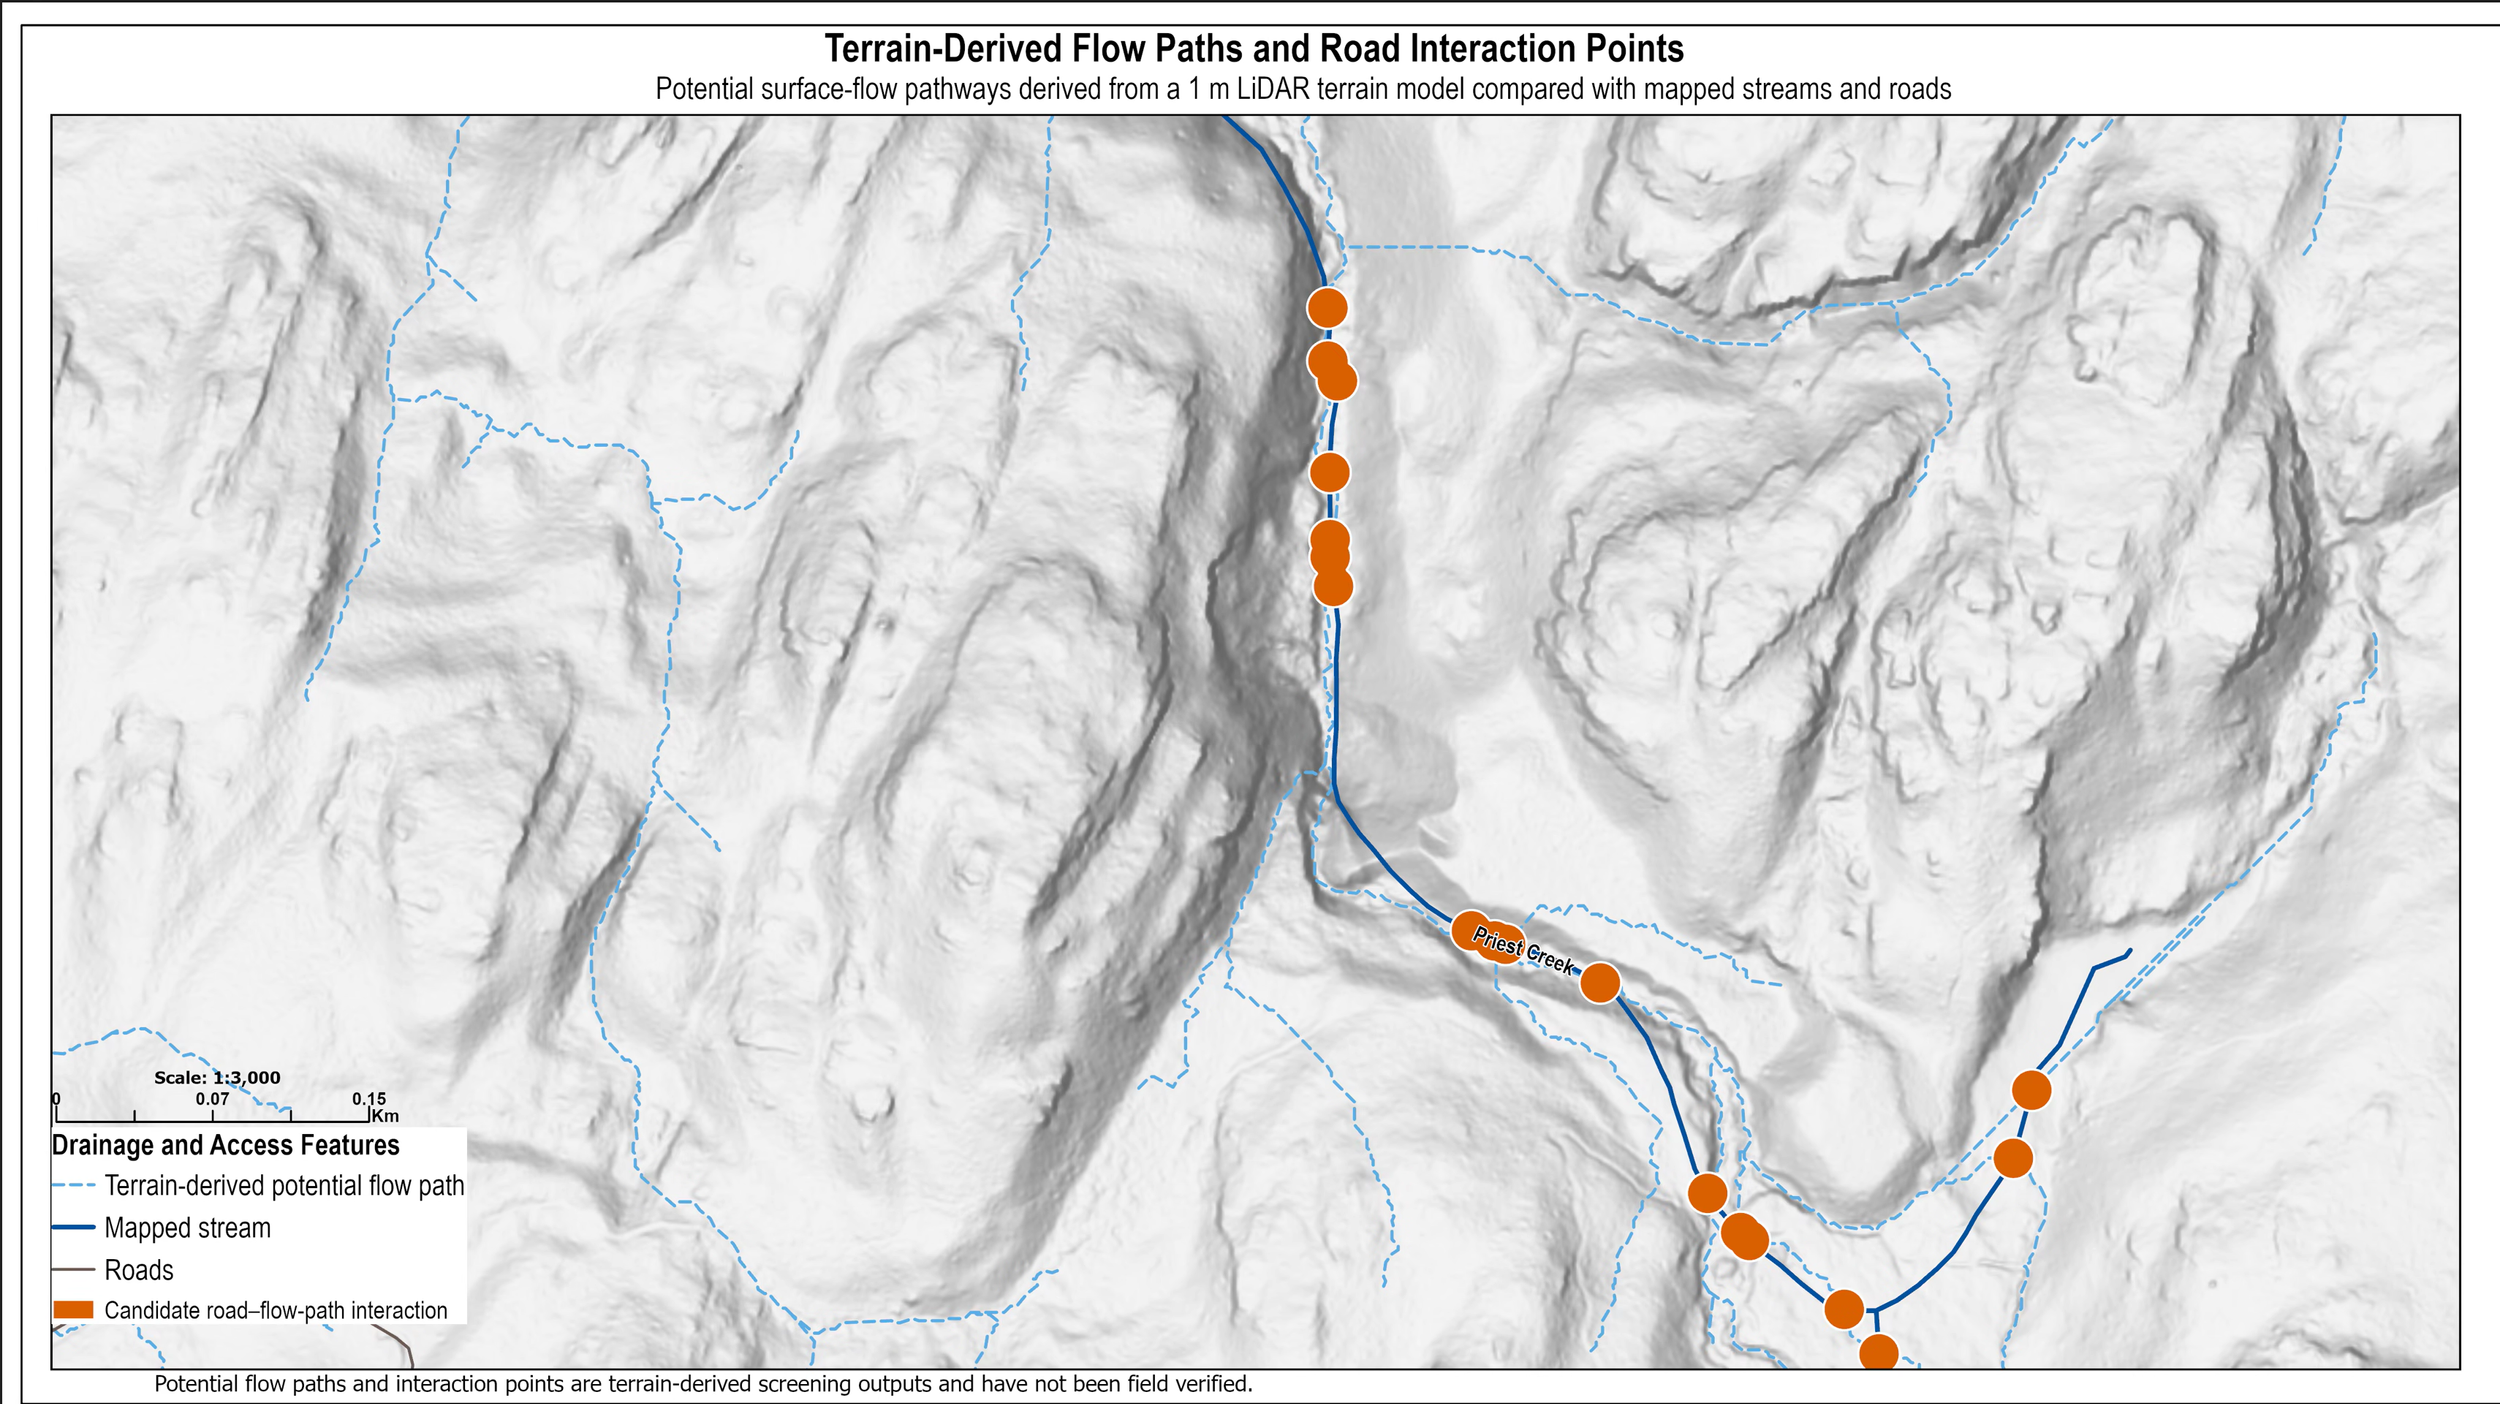
LiDAR-derived potential surface-flow pathways compared with mapped hydrography and roads to identify candidate road–drainage interaction locations.

This representative portfolio workflow was developed using publicly available provincial datasets. Canopy-height classes are illustrative structural categories, and terrain-derived flow paths and interaction points are preliminary screening outputs. The results are not an official forest inventory, engineering assessment, hydrologic study, or field-verified operational product